Chapter 2 Long-distance signaling using pulsatile amplification
2.1 Introduction
Quorum sensing circuits, auto-inductive genetic circuits used by wild bacteria for collective decision-making, are a popular platform for designing synthetic communication circuits. Conventionally, quorum sensing circuits are understood to allow groups of cells to estimate their local density. The signaling molecule promotes expression of its associated synthase protein, forming a positive-feedback loop that enables a rapid transition from low to high signal production rate once cell density passes a “quorum” threshold (Dockery and Keener (2001) Redfield (2002)). These natural systems have been applied relatively intact to synthetic applications, such as a circuit that delays expression of an engineered biosynthetic pathway until a quorum has been achieved (Gupta et al. (2017)). With small alterations to the feedback structure, these components can yield complex dynamical behaviors in multi-strain consortia (Youk and Lim (2014)). Two recent examples involve bidirectional signaling between two strains in a co-culture, in one case to achieve sustained oscillations in fluorescent protein expression and in another to recreate the classical predatory-prey dynamical system in an E. coli co-culture through AHL-controlled suicide and toxin-rescue circuits (Chen et al. (2015), Balagaddé et al. (2008)). Transcriptional oscillators that include a quorum sensing-like positive feedback loop tend towards phase synchronization within consortia. Depending on the diffusive environment and diffusion rate of the chemical species shared between cells, this synchronization tendency leads to different emergent behaviors. Low diffusion coefficients of signal chemicals or rapid extracellular signal loss rates produce traveling waves (~1.2 mm/hr) through dense consortia (Danino et al. (2010)). Higher diffusion coefficients or low rates of extracellular signal loss can enable synchronous oscillations over long distances (~2 mm) (Prindle et al. (2012), Kim et al. (2019)).
Other applications, however, call for aperiodic yet repeated cell-cell communication and cannot rely on the circuits mentioned above. Consider a consortium composed of sensor and actuator microbes embedded in an environment that restricts cell movement, such as intestinal mucus in the mammalian gut. The consortium is intended to persist in this environment and monitor it for a rare chemical event. In response to each event detected by the sensor population, the actuator strain should perform a discrete action, such as release a therapeutic small molecule. Without well-mixed conditions, individual sensor cells will differ in exposure to environmental variables of interest and actuators may perceive different concentrations of signal molecule produced by the sensors. These factors reduce the fraction of microbes that participate in signaling, therefore limiting the efficacy of the actuator strains’ impact on the environment.
To overcome the obstacles to group consensus that are inherent to unmixed environments, microbes must collaborate in propagating signals even when they are not the signal’s intended recipient. This is because, without sophisticated self-patterning programs or direct consortia printing, there is no guarantee the intended recipient population will receive a signal. Furthermore, amplification activity must be ephemeral to preclude steady states with high secretion rate and non-oscillatory in order to match propagated signals to individual initiation events. Signaling via traveling pulses, like action potentials through nervous tissue, achieves these two requirements (Holzer, Doelman, and Kaper (2013)).
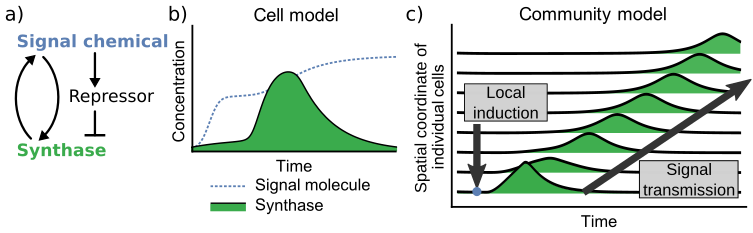
Figure 2.1: Abstracted interaction map of the species comprising the pulsatile gene circuit as well as two simulations of its behavior, one in well-mixed conditions and the other in a diffusive environment. The circuit schematic (a) depicts the positive-feedback relationship between the signal chemical and its synthase as well as the negative feedforward arm connecting the same signal chemical to a repressor that shuts off synthase production. In this model of a pulsatile gene circuit, a large expression delay is included that is not a part of the other models described in this document. This delay was included to make the spike-in signal chemical and cell-generated signal chemical distinct bumps in the under the “Cell model” figure, (b). The “community model” in (c) represents a scenario in which a 1D region of cells, each expressing the pulsatile circuit, is perturbed by a local addition of signal molecule. The ensemble effect of each cell amplifying local AHL concentration results in a traveling pulses of signaling activity that moves away from the perturbation where they initiated.
Figure 2.1 shows a simplified circuit diagram of a pulsatile amplifier and two simulations demonstrating its behavior in well-mixed and diffusive environments. Pulsatile communication requires only ephemeral investment in the protein components and signal molecules used in cell-cell signaling, making it a relatively low-burden approach to coordination compared to bistable or oscillatory circuits. When designing a multi-strain bacterial device, or any consortium that may experience a spatially heterogeneous front of chemical signals, these features are necessary for reliable, long-distance cell-cell signaling. This system would enable cells to initiate and transmit communications without permanently altering their internal transcriptional state or spontaneously generating signals at regular intervals.
2.2 Characterizing genetic components in liquid culture
Lux-type quorum sensing systems include a transcription activator (receptor), an acyl-homoserine lactone (AHL) signal molecule1, and an enzyme that synthesizes the signal molecule (synthase). In these systems, the receptor binds to its cognate signal molecule and promotes transcription of the synthase to form a positive feedback loop. Cells expressing this type of gene circuit exhibit switch-like behavior between a low-output state and a high-output state. Stability analysis shows the low-output state to have a narrower margin of stability than the high-output state, which is stabilized by the structure of the feedback loop as well as local accumulation of AHL (Doelman (2019), Dockery and Keener (2001)).
To engineer pulsatile release of signaling molecules, we augment a Lux-type positive feedback system with a negative feedforward arm to eliminate persistence of the high-output state.2 The combined regulatory arms form a well-studied architecture known as a Type-I incoherent feedforward loop (IFFL) that generates pulses in response to increases in the input (Goentoro et al. (2009), Alon (2006)). This negative regulation is accomplished by a transcriptional repressor that, like the synthase, is regulated by the receptor. When exposed to AHL, the cell begins to express both synthase and repressor. The promoter controlling synthase expression therefore contains binding sites for the activating and repressing transcription factors. Soon after, the accumulated repressor protein prevents further expression of the synthase, which allows for a gradual return to a low-expression state. Repressor protein will continue to be expressed, however, as long as the AHL concentration is sufficient. The concentration of repressor must be reduced through degradation or dilution from cell growth before the circuit can generate a pulse of synthase expression again. This architecture elicits pulses in a similar manner as neurons: rapid excitation followed by a long refractory period (Holzer, Doelman, and Kaper (2013)).
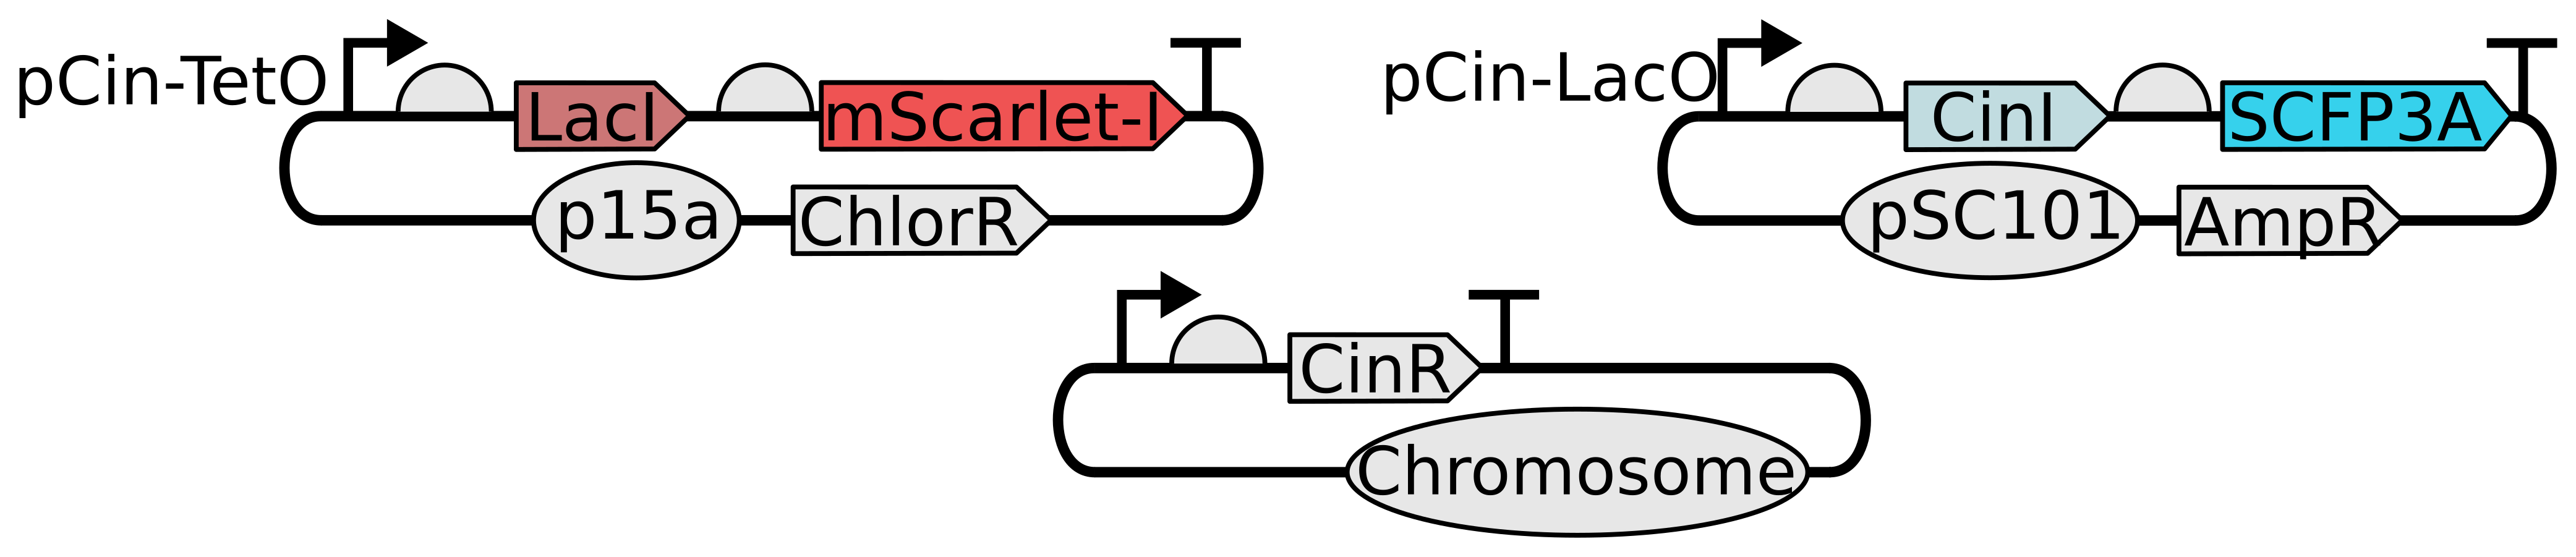
Figure 2.2: The genetic components of the pulsatile communication circuit. Quorum sensing components are drawn from the CinRI system from the species Rhizobium leguminosarum. The synthase protein, CinI, produces N-(3-hydroxy-7-cis-tetradecanoyl)-L-homoserine lactone (referred to as AHL in the context of the Cin system for convenience) (Lithgow et al. (2000)). CinR is expressed constitutively, AHL-bound CinR promotes expression from pCin, and LacI represses CinI transcription when bound to the LacO site. AHL freely diffuses through cell walls.
IFFL gene circuit generates pulses of synthase protein
The positive and negative regulation arms were cloned into different plasmids. CinI, the synthase protein used in this circuit, was cloned onto a low-copy pSC101 vector and the repressor, LacI, onto a p15a backbone. By dividing the circuit between two plasmids, a larger pool of strain candidates could be generated via combinations of a handful of plasmid candidates. As shown in Figure 2.2, co-transcriptional fluorescent reporters were appended to both the LacI and CinI coding sequences. Including these co-transcriptional reporters provides an unique marker of transcription activity for the two circuit promoters. In all experiments, plasmids were transformed into CY026, an E. coli strain that constitutively expresses CinR (Chen et al. (2015)).
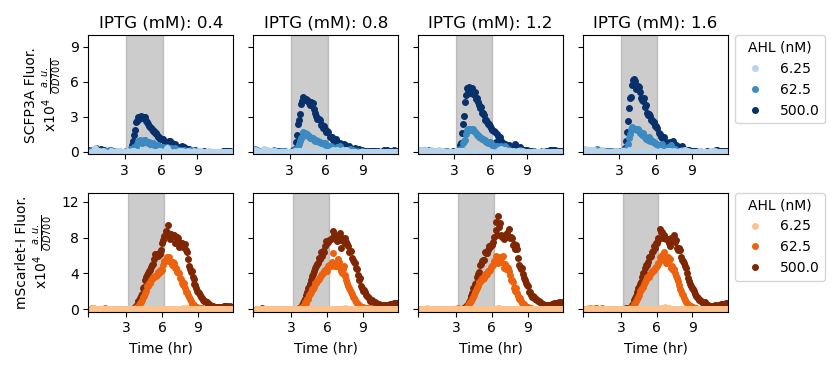
Figure 2.3: A series of experiments were performed wherein one inducer, IPTG, was kept at a constant concentration while another inducer, AHL, was introduced and then removed. The dark gray region indicates the period of time when AHL was included in the growth media. OD-normalized fluorescence data from these experiments. This figure only shows data collected from the candidate strain that demonstrated pulsatile response to AHL and showed the fastest doubling time.
We performed liquid culture in vivo experiments screening plasmid variants that differed in ribosomal binding site sequences 5’ of the LacI and CinI coding regions. Two rounds of characterization were performed to optimize circuit behavior. In the first round, strains harboring repressor plasmid candidates were subjected to an induction ladder of the signal chemical. Plasmid candidates that did not fluoresce or that significantly reduced doubling time were removed from further consideration. In the following round, both repressor and synthase plasmid variants were co-transformed and strains were subjected to a grid of conditions varying in both AHL and IPTG concentrations. Candidates in this round of characterization were screened for pulsatile expression of the synthase-associated fluorescent reporter and robust cell growth. The behavior of the best-performing strain is shown in Figure 2.3. The data in this figure show that the IFFL architecture produces pulsatile synthase expression only in the presence of both AHL and IPTG. Growing cells expressing the pulsatile amplifier circuit do not produce fluorescent protein when grown in high-IPTG media, indicating that leaky expression does not result in spurious activation of the positive-feedback loop, thus generating a spurious signal, or the negative feedforward arm. During the period of AHL induction the synthase reporter shows a pulsatile response while the repressor reporter increases unceasingly. Following stimulation, when cells are grown in low-AHL and high-IPTG media, there are no subsequent pulses or increases in the synthase reporter trace. The selected candidate shows well-tuned pulsatile behavior in response to exogenous AHL.
IPTG tunes synthase pulse amplitude but not repressor expression
Both inducers, AHL and IPTG, are necessary for significant expression of the synthase co-transcriptional fluorescent reporter. This suggests that, before inducers are added, cells have accumulated enough LacI to block AHL-activated expression of the synthase. Alleviating LacI-mediated repression by including IPTG in the growth media allows for modulating the pulse height of synthase expression, a useful feature for experiments involving cell-cell signaling. Figure 2.4b) shows that, without added IPTG, no synthase expression is permitted.
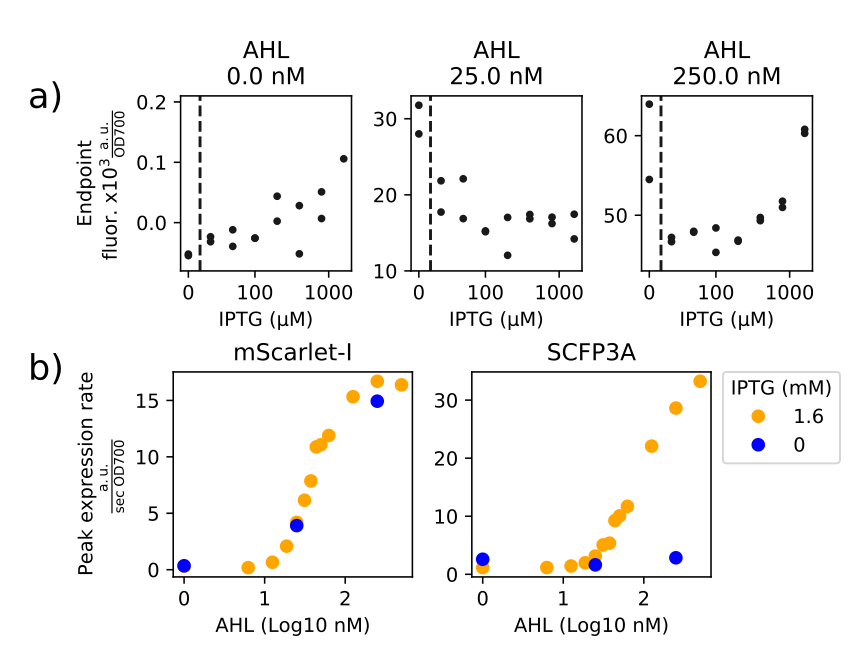
Figure 2.4: (a) mScarlet-I endpoint fluorescence from experimental wells varying in AHL and IPTG concentration. Fluorescence traces are normalized by OD700 and endpoints were taken to be the median value from timepoints with OD700 greater than 0.9. The x-axes are logarithmic in scale, the dashed vertical line separates the logarithmic scale from the zero IPTG concentration data. Pearson’s correlation coefficients for data presented in each plot are 0.834, -0.369, 0.564, respecting plot order. (b) Maximum expression rate values from both mScarlet-I and SCFP3A channels at varying AHL and IPTG concentrations. These correspond to expression activity from repressor and synthase arms of the transcriptional network, respectively, and the data show that IPTG is necessary for synthase activity and that IPTG does drastically impact repressor expression.
While the circuit succeeded in eliciting a pulse of expression, the data did not show a clear relationship between amplitude of the synthase pulse and an increase in AHL concentration in the growth media. Activity from the LacI cistron was not highly correlated with IPTG concentration, meaning that synthase expression did not lead to increased AHL-mediated gene expression. Figure 2.4a) shows the impact of varying IPTG concentration at three AHL concentrations. At 0 nM, IPTG correlates with higher endpoint fluorescence (\(\rho=0.834\)), though its effect is relatively negligible. Sensitivity to changes in AHL concentration should be greatest near a promoter’s half-maximum induction concentration (IC50). The half-maximum AHL induction concentration of the negative cistron’s promoter is roughly 40 nM. Even if the contribution of AHL from the amplifier cells were small, such as on the order of 5 nM, that would likely result in a detectable change in mScarlet-I fluorescence. However, unlike the simulation shown in Figure 2.1, this implementation of the amplifier circuit failed to noticeably increase AHL concentrations. Above the twice the IC50 concentration, promoters are less sensitive to changes in inducer concentrations but may still result in detectable changes in the accumulated fluorescence after a long enough time. The fact that the endpoint fluorescence from high-IPTG samples fall within the range of values from no-IPTG samples suggests that, even when activity synthase activity is driven to its maximum, the change in AHL concentration remained constant over the course of the experiments. The short pulse width, well-mixed media, and low cell density during synthase expression act to minimize signal retention within the cells. While chemical quantification procedures could provide insight on the absolute amount of signaling molecule secreted by the amplifier cells during an experiment, the purpose for this strain is to facilitate AHL-based communication between cells (Yates et al. (2002)). When applied to well-mixed conditions, the amplifier cells were not be able to amplify their own response.
2.3 Extending signaling distance in semi-solid media
This chapter describes the time-lapse microscopy experiments performed to investigate the capability of the amplifier strain to support cell-cell signaling over long distances for consortia growing on semi-solid media. While the amplifier strain appeared unable to support cell-cell signaling within well-mixed liquid cultures, cells have greater leverage over their local chemical environments in unmixed conditions. In these diffusive environments, transport of small chemical species is achieved only due to diffusion, and therefore secreted chemicals accrue more rapidly in comparison to liquid media with convection-mediated mixing. Wild microbes in diffusive environments transmit chemical signals over long distances by the combined action of positive feedback loops expressed by dense communities of cells (Goldbeter (2006), Noorbakhsh et al. (2015), Larkin et al. (2018), Prindle et al. (2015)). Here, we apply the pulsatile amplifier circuit characterized in Section 2.2 in an attempt to recreate the same emergent behavior.
Recent work investigating the difference between diffusive waves generated by passive or active propagation of chemical fronts shape our expectations for the pulse amplifier circuit. Passive propagation is the case in which sender agents are the sole source of signal chemicals. The diffusive wave is shaped by the diffusive environment, production rate, and degradation rate of the signal chemical. Both theoretical and experimental studies show that passive propagation can result in either constant-velocity fronts, diminishing-velocity fronts, or asymptotic fronts that approach a steady state concentration profile (Reátegui et al. (2017), Dieterle et al. (2020), Gines et al. (2017), Alon (2006), Wolpert (1969)). Adding a mechanism for active front propagation, often a bistable positive feedback loop, increases transmission velocity and yields a fixed-velocity diffusive wave when the release rate of the amplifiers is sufficient (Gines et al. (2017), Dieterle et al. (2020), Cheng and Ferrell (2018)). However, the scenario of interest here is complicated by the logistic growth and time-varying protein expression capacity of cells in the synthetic bacterial consortia. It is difficult to predict given the data from liquid culture characterization what impact the amplifier strain will have on the diffusive wave dynamics, given the difficulty in analyzing the scenario mathematically.
Quantifying the extent to which the amplifier circuit extends communication distances requires as direct a comparison as possible between indicators of local AHL concentrations through the semi-solid media. That is accomplished by composing two consortia, one composed of a signal source and signal reporter and the other composed of a signal source and the signal amplifier strain. Each consortia is applied to the same scenario: the sender population is localized to one end of a long, rectangular agarose pad and its partner strain and its partner strain occupies the complementary region of the pad. After inoculating the surface of an agarose pad, the inducer chemicals embedded in the agarose stimulate the sender component to produce synthase protein and release signaling molecules. Following this, the signaling molecules diffuse to the partner strain, which is either the reporter or amplifier strain. If the amplifier cells can appreciably increase local signaling molecule concentrations, then the sender-amplifier consortium should produce a larger activated region of the pad than the sender-receiver consortium. Because the amplifier cells strictly increase AHL amounts, it is expected that the sender-amplifier consortium will elicit a higher degree of activation than the sender-reporter consortium.
Here, the role of a reporter component in a consortium is to produce fluorescent protein in response to signal molecule. Consider the amplifier strain’s two fluorescent proteins, mScarlet-I and SCFP3A. Transcription of SCFP3A is controlled both by AHL-mediated activation and LacI-mediated repression, therefore it is not a reliable reporter of local AHL concentrations. mScarlet-I, on the other hand, is under singular control by AHL-activated expression and can be used as an AHL reporter. It would be convenient if the fluorescent reporters in the sender-reporter and sender-amplifier consortia could be assumed to have identical activity as a function of AHL.
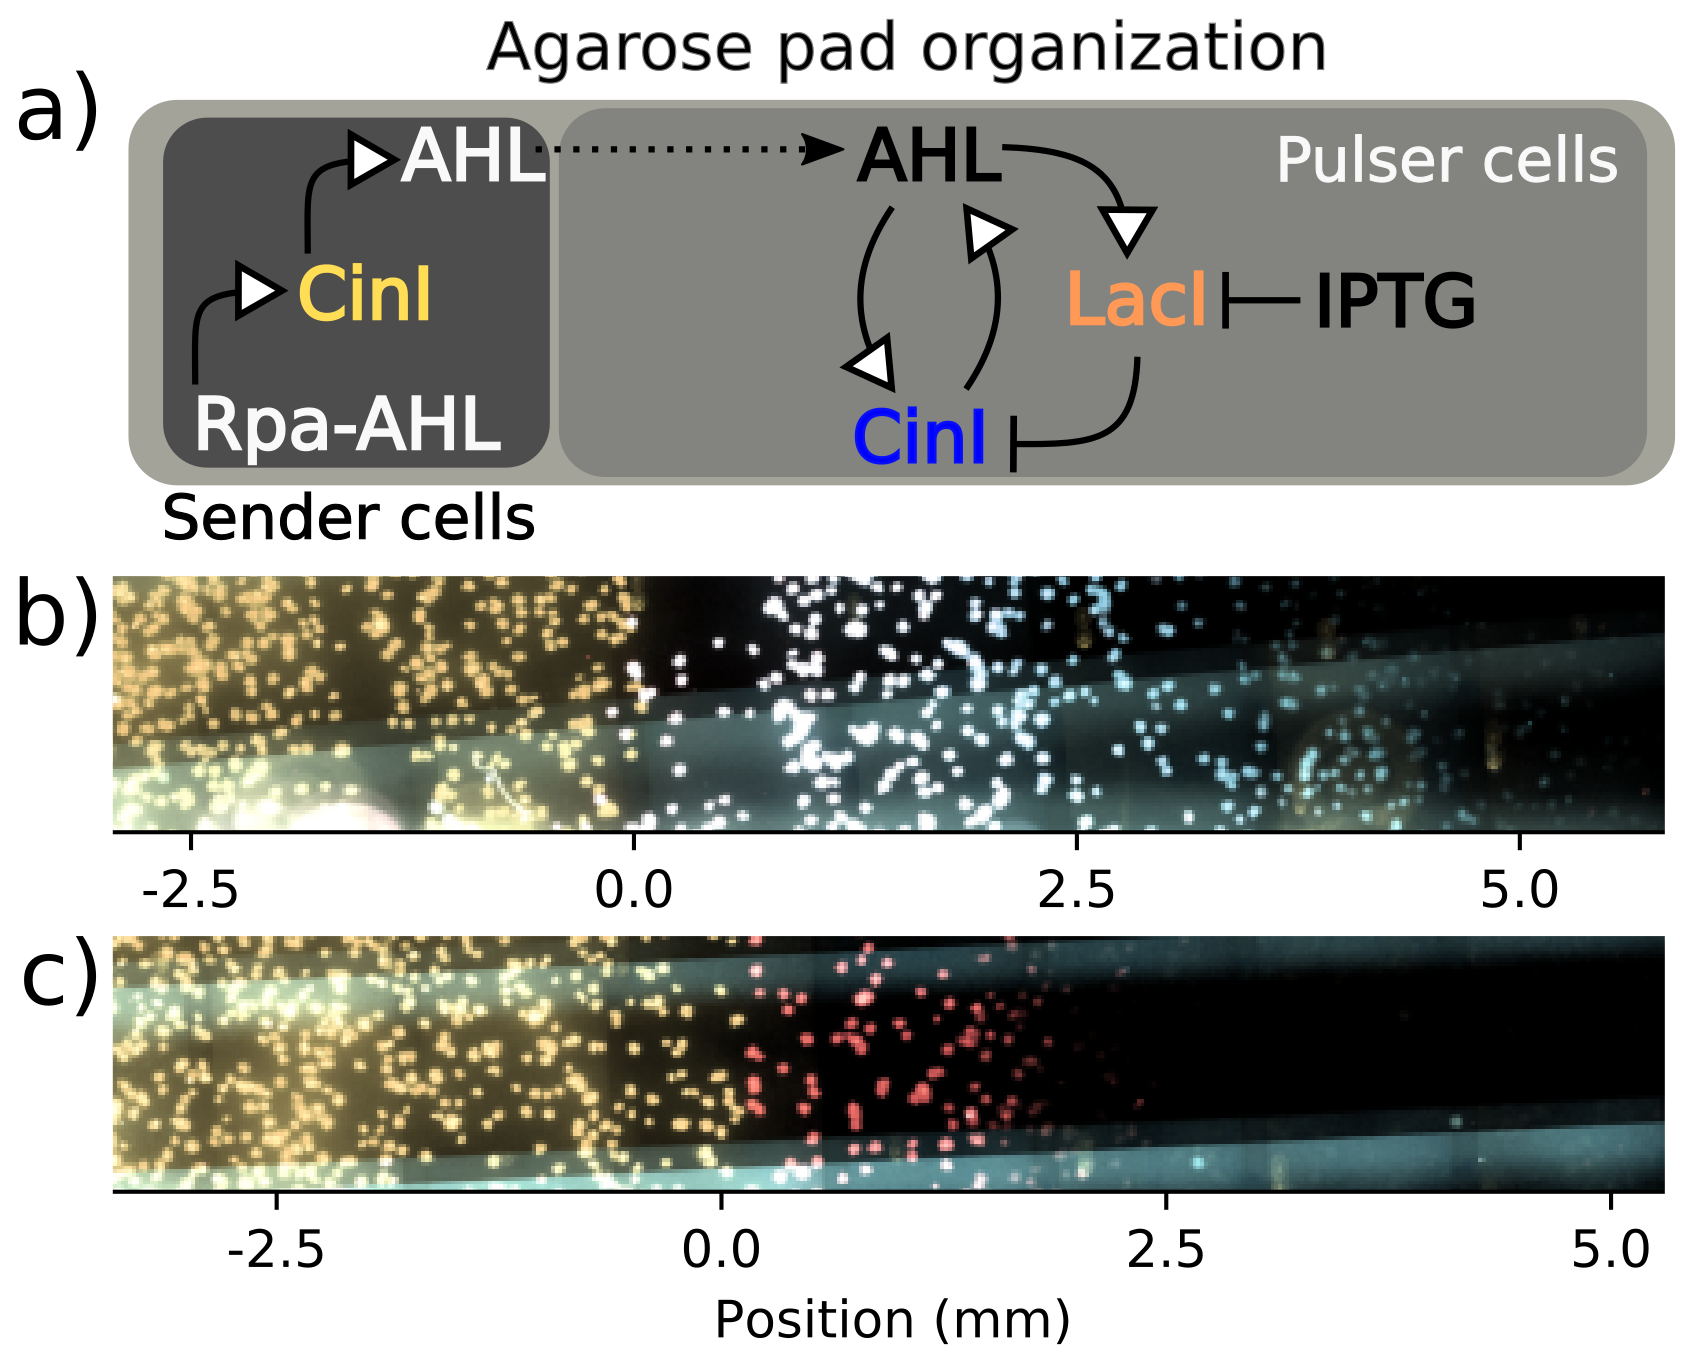
Figure 2.5: Schematic (a) summarizes the experimental setup described in the text, with shaded regions corresponding to the portions of the agar pad occupied by the sender and pulser cell strains. This subfigure also depicts abbreviated transcriptional networks of the sender and pulser strains. Subfigure (b) includes an image from a time-lapse microscopy experiment of a sender-amplifier consortium. Subfigures (b-c) are fluorescence micrographs where yellow indicates sender activity, red indicates repressor activity, and blue indicates synthase activity. Subfigure (c) is a sender-receiver consortium from the same experiment imaged at the same time, 4 hours after pad inoculation. These images show the initiation of cell-cell communication, when sender cells have secreted sufficient AHL to elicit a response from their consortium partners. Amplifier cells fluoresce in both SCFP3A and mScarlet-I channels, which can appear white in the composite image. Position values are relative to the interior end of the sender population.
Fortunately, the sender-amplifier and sender-reporter consortia can be formed from the same pair of engineered strains. As demonstrated in the previous section, IPTG is required for synthase expression yet does not impact mScarlet-I expression (see Figure 2.4. When deployed to pads lacking IPTG, the amplifier cells cannot signal to their neighbors and therefore take the role of signal reporter. This is an ideal scenario, as the genetic and kinetic details of transcription factor binding sites as well as the metabolic load on the host cell from propagating transgenic plasmids are kept constant between the two consortia.
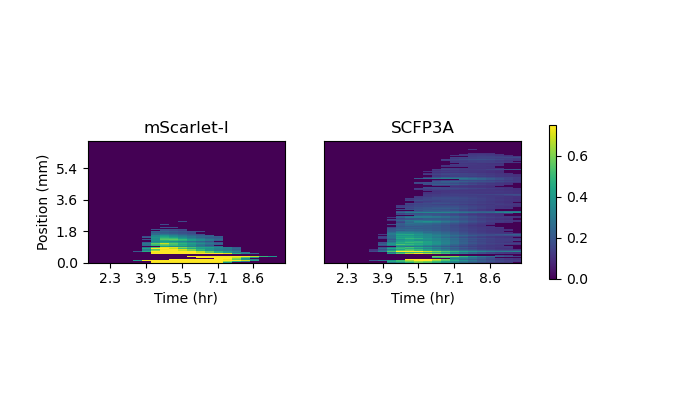
Figure 2.6: The two plots depict mean fluorescence values along the sender-amplifier consortium at each acquisition time. Images were first rotated such that the agarose pad’s long axis was parallel to the image’s column axis. Mean fluorescence values were determined by averaging the pixels above a threshold value at each image column. Stacking these vectors for each time point results in the heatmaps shown.
During agarose pad time-lapse microscopy experiments, cells are sandwiched between the agarose pad and a glass-bottomed dish. A depiction of consortium organization is shown in Figure 2.5. This restricts their movement while the signaling molecules they secrete can diffuse through the aqueous growth media contained in the pad. As a result, a small group of signal-secreting cells can locally accumulate a significant concentration of signal molecule more easily than in a well-mixed media of the same volume. The geometry and organization of cells on the agarose pads were both selected to maximize the rate at which sender cells locally accumulate signaling molecule. The rate at which diffusion draws signal chemicals away from their origin is significantly increased with each dimension permitting transport (Dieterle et al. (2020)). By isolating the sender cell population to one end of a pad, diffusion mainly acts to transport molecules in one direction: towards the interior. This reduces the impact of diffusion and leads to more rapid accumulation.
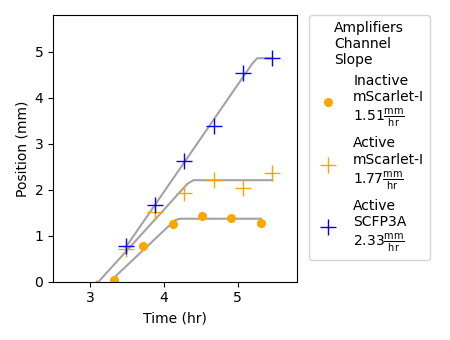
Figure 2.7: This plot shows the progression of SCFP3A and mScarlet-I fluorescence profiles recorded along agarose pads organized as in Figure 2.5. To determine the position of the signaling front, a threshold was applied to the fluorescence values at each frame. The points depicted in the plot correspond to the position farthest from the sender population that surpasses the threshold value. Threshold values were selected for each experiment to best capture the movement of the signaling front. Best-fit lines of the form \(\text{Min}(at+b,c)\), where \(t\) is time, were fit by least squares. Estimates of propagation velocity (\(a\)) and maximum propagation distance (\(c\)) taken from these best-fit lines.
A depiction of consortium organization is shown in Figure 2.5. Sender cells are the CY026 strain of E. coli co-transformed with two plasmids. One plasmid is a clone of the amplifier strain’s negative regulation plasmid but with a large deletion in the LacI CDS. This loss-of-function deletion preserves the genetic context surrounding the AHL-associated promoter and the downstream reporter CDS in order to preserve its behavior as a reporter. Similarly, the other plasmid was designed to resemble the amplifier strain’s positive feedback plasmid. It also uses a pSC101 backbone and codes for a bicistronic transcript of CinI and a reporter protein, but the reporter is sfYFP and the promoter is pRpa, a quorum-sensing promoter from the Rpa operon of the species Rhodepsuedomonas palustris. This sender plasmid also contains a constitutive source of RpaR, the receptor for p-courmaroyl-HSL (Rpa-AHL).
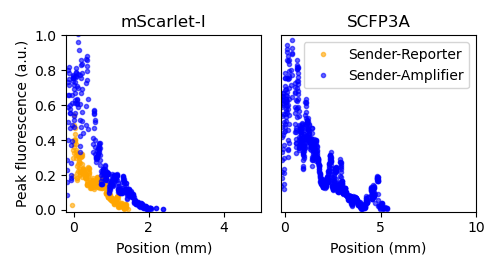
Figure 2.8: Peak fluorescence values were determined by calculating the average above-threshold fluorescence value at each distance and time, in the same manner that produced the heatmaps in Figure 2.6, then finding the maximum value attained at each distance over the course of the experiment.
Pulsatile signal amplification extends communication distance along one-dimensional, segrated sender-receiver consortia
Each time-lapse microscopy experiment includes four agarose pads mixed with a different set of inducer chemicals. The inducer sets are the four combinations of the presence or absence of Rpa-AHL and of IPTG. Rpa-AHL is used to activate synthase production within the sender cells and IPTG is used to enable the amplifier circuit in the amplifier cells. Table 2.1 shows the state of the sender and amplifier cells under each condition. Pads lacking inducers should result in no fluorescence from any cell. Images from these pads provides data on the background fluorescence from the agarose pad itself and the dividing cells. Pads with only IPTG included test the stability of the pulse circuit’s ``off’’ state, when sender cells are absent or inactive. While sender cells are inactive, it is not uncommon for asymmetric plasmid distribution during cell division to result in daughter cells lacking the negative regulation arm of the amplifier circuit, reducing it to a positive feedback loop around the synthase protein (Halleran, Flores-Bautista, and Murray (2019)). Cells lacking the negative regulation plasmid quickly lose cytosolic LacI, at which point they can rapidly switch to a high synthase expression state. This experimental control is necessary to monitor the effect of these errant positive feedback loops; spurious pulses generated by mutants would indicate that the signal amplifier is unreliable.
With only Rpa-AHL, senders are spurred to transmit signaling molecules to the inactive amplifier cells. Unable to produce synthases themselves, the receiver cells’ repressor arm reports on the local abundance of signaling molecules generated by the sender cells. The propagation of this fluorescence front provides negative control of passive signal transport.
| Condition | Senders | Amplifiers | Inducers included |
|---|---|---|---|
| Autofluorescence blank | Inactive | Inactive | None |
| Sender leak and amplifier self-activation | Inactive | Active | Rpa-AHL |
| Sender-Reporter | Active | Inactive | IPTG |
| Sender-Amplifier | Active | Active | Rpa-AHL + IPTG |
Subfigures (b) and (c) in Figure 2.5 show false-colored images produced from the fluorescence micrographs of the sender-amplifier and sender-reporter agarose pads, respectively. From these images, it is clear that the sender cells on both pads can communicate to their partner strains that are nearby. Threshold-crossing points depicted in Figures 2.7 show that the region of mScarlet-I activation extends farther from the sender population in the sender-amplifier consortium than in the sender-reporter consortium. Fluorescence output is analyzed by manually selecting a threshold value and eliminating data that falls below this value. The position and average fluorescence of the response profile can then be determined by the above-threshold pixels. Figure 2.7 shows the positions of the leading edge of the traveling pulse over time for each experimental condition and channel.
Data from the sender-amplifier pad shows SCFP3A activity extending farther into the interior of the pad than mScarlet-I. This matches the observation from the liquid-culture experiments that mScarlet-I detection is delayed relative to SCFP3A. However, translation of the mScarlet-I front halts before the SCFP3A front. The promoters in the negative and positive regulation arms have similar AHL activation curves (see Figure 2.4); where amplifier cells can express SCFP3A, they should also be able to express mScarlet-I. Figure 2.6 shows the mean fluorescence from the sender-amplifier consortium along the direction of propagation. Expression in the mScarlet-I channel appears to halt abruptly after about 2.5mm of translation. Activation beyond that distance does not remain above the threshold value.
The time-lapse microscopy data show that the amplifier cells fail to maintain pulse amplitude over the propagation direction. Figure 2.8 shows the peak fluorescence value achieved at each position over the course of the experiment. In both channels, peak fluorescence drops continuously as signaling activity invades the center of the pad. The SCFP3A channel exhibits a linear trend while the mScarlet-I decline appears more similar to an exponential decay. Active amplifier cells significantly improve the response in the mScarlet-I channel relative to the sender-receiver consortium by increasing recruitment and by increasing peak response near overall. However, the diminishing amplitude and truncated mScarlet-I propagation relative to SCFP3A propagation through the amplifier population both suggest that, after a certain amount of time, the growth rate and protein expression capacity of cells on the agarose slows to the point that host cells can no longer contribute resources to transgene expression.
Increased sender emission rate extends sender-receiver signaling distance
Both sender-amplifier and sender-receiver consortia exhibited fixed-velocity propagation of signaling activity followed by an abrupt stalling and cessation of propagation. This raises the question of whether sender-receiver consortia can extend signal propagation without the aid of amplifier cells by simply increasing their signal production rate. To that end, a variant of the sender strain with a greater signal secretion rate was cloned. This strain was applied to a similar agarose pad organization as described above and the propagation of receiver activity was observed.
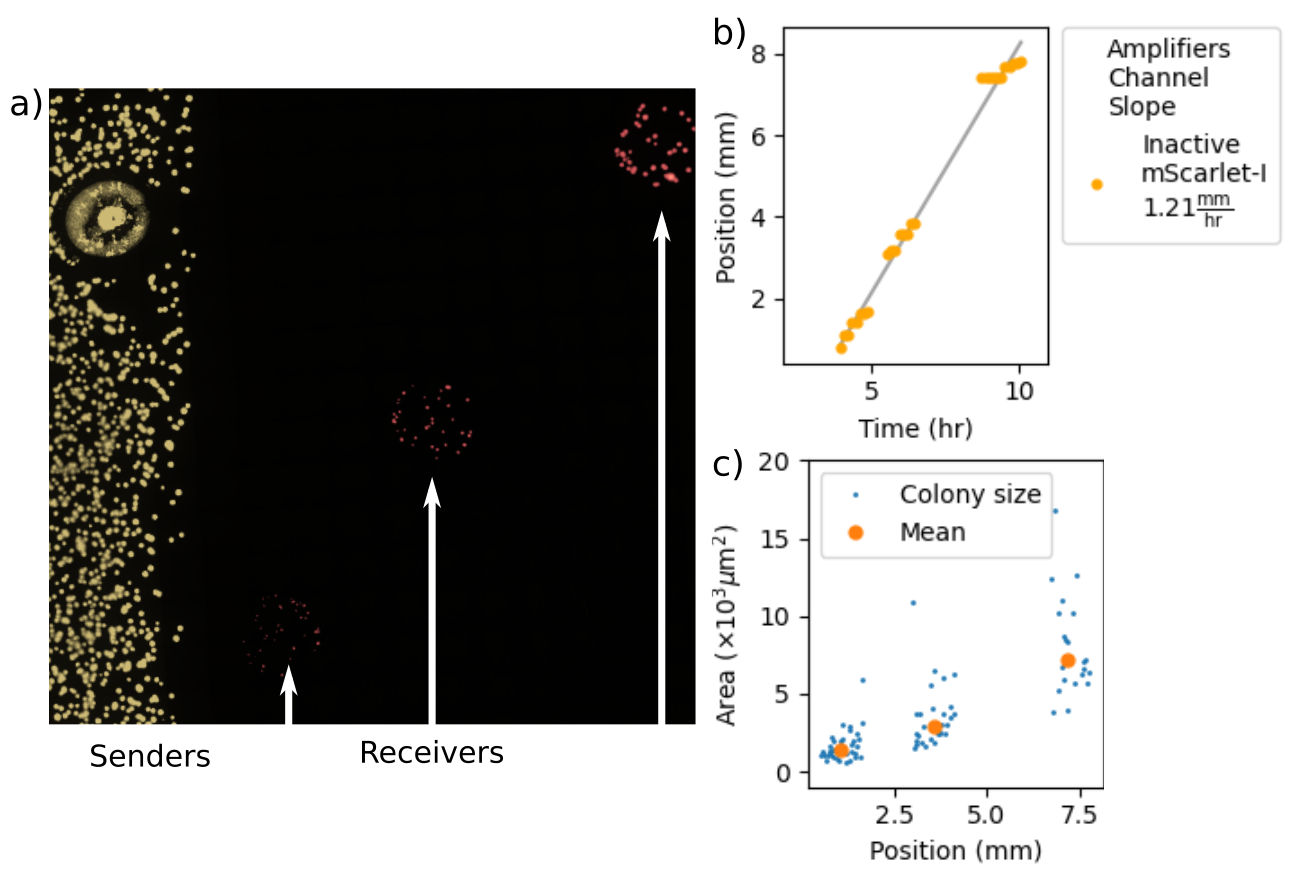
Figure 2.9: Measuring propagation distance and velocity from a stronger sender cell variant. (a) shows a fluorescence micrograph of sfYFP and mScarlet-I fluorescence. sfYFP indicates synthase expression within sender cells and mScarlet-I indicates AHL-induced expression within receiver cells. The sender population spans the width of the agarose pad while receiver cells were deposited at three different positions. White arrows direct to the positions of the deposited receivers. (b) depicts threshold-crossing events determined from fluorescence of the receiver cells. The three clusters of data points correspond to the three receiver depositions in (a). (c) shows the areas of each microcolony and mean areas at each deposition after 13 hours.
Figure 2.9 shows both a fluorescence micrograph of the experimental agarose pad as well as a plot depicting threshold-crossing events within the receiver cells. The threshold-crossing events show a fixed-velocity propagation that is similar in speed to that produced by the weaker sender strain. Its transmission distance, however, is much greater. This experiment shows that, along one-dimensional consortia and diffusive environments, sender cells can produce diffusive waves that are as rapid and travel as far as the sender-amplifier consortium.
The microcolony sizes diminish with proximity to the sender population. Theoretical studies suggest that, in the case of a homogeneous and static consortium, pulsatile amplification produces a flat concentration profile over the region traversed by a propagated diffusive wave (Dieterle et al. (2020)). Persistent emission from a sender population, however, will result in an exponential concentration gradient over space. The microcolony area data depicted in Figure 2.9c) indicate that the AHL concentration near the sender population drives receiver cells to over-express LacI and mScarlet-I to the point that cell growth slows down. Receiver cells that are farther away are larger due to the decreasing AHL gradient a delay before the diffusive wave arrives. The growth penalty in the receiver strains shows that, while the diffusive wave is rapid and long-ranged, the steep concentration gradient can be toxic to receiver cells.
Bistable amplifier strain
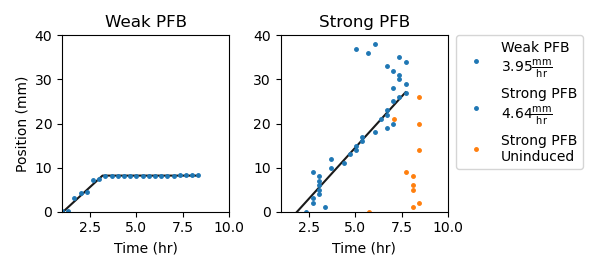
Figure 2.10: Comparing signaling propagation through bistable amplifier cells with different 5’ UTR sequences controlling ribosomal binding to mRNA transcripts. Threshold-crossing events are grouped into 1mm-wide bins. The data points with smallest time value from each bin are plotted and used in fitting trend lines. Trend lines are piecewise, with a linear and flat components. Both “weak” and “strong” positive feedback circuits uniformly deposited over a long agarose pad. In control samples, cells were grown without inducer chemicals. In experimental samples, a 25nL droplet of 50uM C4-HSL was deposited at the 0 mm position and allowed to dry before imaging.
The pulse amplifier circuit limits the maximum expression rate through the promoter controlling synthase mRNA transcription by LacI-mediated repression and by the metabolic investment in LacI and mScarlet-I. It is well-known that signal production rate scales with the propagation velocity in diffusive waves (Dieterle et al. (2020), Oleinik, Kolmogorov, and Piskunov (2019)). Engineering an amplifier strain that propagates signaling activity more quickly could make use of a bistable rather than pulse-generating circuit by reducing the number of protein components and the removal of the transcriptional repressor.
A bistable amplifier strain was engineered to express a positive feedback loop controlling synthase production, similar to natural quorum sensing motifs. This circuit used components from the Rhl quorum sensing system from the species Pseudomonas aeruginosa. The AHL variety associated with the Rhl system is C4-HSL, a homoserine lactone with a four-carbon acyl chain (Pearson, Van Delden, and Iglewski (1999)). This molecule is much smaller than C14-HSL, the AHL molecule associated with the CinRI system used in the pulsatile amplifier circuit, and therefore has a larger diffusion coefficient. While the transcription dynamics of the Rhl quorum sensing components are likely different from those of the Cin quorum sensing system, the lack of negative regulation on the synthase promoter, reduced metabolic load, and smaller AHL molecule could allow for an upper-bound estimate of the propagation velocity of AHL-mediated signal propagation along one dimension.
Figure 2.10 traces cell-cell signaling propagation through amplifier cells expressing either a “weak” or “strong” bistable quorum sensing circuit. The “weak” positive feedback appears to be insufficient for generating traveling waves and reaches only ~10mm into the interior of the pad. The “strong” circuit, however, shows a fixed-velocity traveling wave of signaling activity that traverses ~30mm. Data from the uninduced control of the “strong” positive feedback circuit shows a synchronous self-activation at around 8 hours, demonstrating that the low-expression state becomes unstable as cell density increases. A spurious signal can be seen in the induced case as well, initiating at position 40mm and 5 hours and moving towards the interior, eventually meeting the induced signaling wave at position 30mm and 7 hours. These results suggest a possible velocity upper-bound to AHL-mediated signaling propagation over one dimension and highlight a difficulty in engineering feedback within growing synthetic bacterial consortia.
2.4 Methods
Liquid culture experiments were performed in a Biotek Synergy H1F plate reader using M9CA minimal media (Teknova product code M8010-06) with 100 \(\mu\)g/mL ampicillin and 34 \(\mu\)g/mL chloramphenicol. Starter cultures were inoculated into M9CA media from single colonies picked from an agar plate. Inoculated cultures were shaken and incubated at 37\(^\circ\)C until the optical density at 700 nm measured ~0.3. The experimental wells were then prepared by diluting starter cultures 1:20 into a final volume of 500\(\mu\)L in a 96-well glass-bottom plate. When necessary, inducer chemicals were added to wells using an Echo 525 acoustic liquid handler before the addition of cell culture and broth.
At two points during the liquid culture experiments, inducer concentrations were altered by diluting and washing experimental cell cultures. Washes were performed by first pelleting the full 500\(\mu\)L of culture from an experimental well, discarding the supernatant, and then resuspending in 15mL of PBS. These wash-discard-resuspend cycles were repeated twice more for a total of three wash cycles. 500 \(\mu\)L of M9CA broth was used in the final resuspension step to return the culture to approximately the same density as before the wash steps. Subsequent experimental wells were prepared by first depositing inducer chemicals as needed with the Echo 525 liquid handler, followed by cell culture and sterile M9CA broth in a 1:20 ratio.
Analysis of data collected from plate reader experiments was performed using custom Python scripts. Background fluorescence and OD700 were determined by measuring these quantities in wells prepared without inducer chemicals, which previous experiments had shown to be identical in fluorescence to cells without fluorescent reporters. These background signals were determined to be time-varying, resulting from either background fluorescence from growing cells or from broth oxidation. OD700-normalized fluorescence values (fluorescence divided by OD700) were calculated using background-subtracted data.
Microscopy experiments were performed using agar pads prepared according to the protocol described in (Young et al. (2012)). Pads were prepared with inducers introduced to the molten agar, when necessary, and 100 \(\mu\)g/mL ampicillin and 34 \(\mu\)g/mL chloramphenicol. When added to molten agar, final IPTG concentration was 1 mM and final C4-HSL concentration was 10 \(\mu\)M. Images were acquired using an Olympus IX81 inverted microscope through a UPlanFl10XPh objective and Chroma filters 31040, 41027, and 310442V2 for sfYFP, mScarlet-I and SCFP3A, respectively. Sample temperature was held at 37\(^{\circ}\)C for the duration of the time-lapse microscopy.
Analysis of data collected from microscopy experiments was performed using custom Python scripts.
References
Alon, Uri. 2006. An introduction to systems biology: Design principles of biological circuits.
Balagaddé, Frederick K., Hao Song, Jun Ozaki, Cynthia H. Collins, Matthew Barnet, Frances H. Arnold, Stephen R. Quake, and Lingchong You. 2008. “A synthetic Escherichia coli predator-prey ecosystem.” Molecular Systems Biology 4 (187): 187. https://doi.org/10.1038/msb.2008.24.
Chen, Ye, Jae Kyoung Kim, Andrew J. Hirning, Krešimir Josić, and Matthew R. Bennett. 2015. “Emergent genetic oscillations in a synthetic microbial consortium.” Science 349 (6251): 986–89. https://doi.org/10.1126/science.aaa3794.
Cheng, Xianrui, and James E. Ferrell. 2018. “Apoptosis propagates through the cytoplasm as trigger waves.” Science 361 (6402): 607–12. https://doi.org/10.1126/science.aah4065.
Danino, Tal, Octavio Mondragón-Palomino, Lev Tsimring, and Jeff Hasty. 2010. “A synchronized quorum of genetic clocks.” Nature 463 (7279): 326–30. https://doi.org/10.1038/nature08753.
Dieterle, Paul B, Jiseon Min, Daniel Irimia, and Ariel Amir. 2020. “Dynamics of diffusive cell signaling relays.” eLife 9. https://doi.org/10.7554/elife.61771.
Dockery, Jack D., and James P. Keener. 2001. “A mathematical model for quorum sensing in Pseudomonas aeruginosa.” Bulletin of Mathematical Biology 63 (1): 95–116. https://doi.org/10.1006/bulm.2000.0205.
Doelman, Arjen. 2019. “Pattern formation in reaction-diffusion systems- an explicit approach.” https://doi.org/10.1142/9789813239609_0004.
Gines, G, A S Zadorin, J.-C Galas, T Fujii, A Estevez-Torres, and Y Rondelez. 2017. “Microscopic agents programmed by DNA circuits.” NATURE NANOTECHNOLOGY | 12. https://doi.org/10.1038/NNANO.2016.299.
Goentoro, Lea, Oren Shoval, Marc W. Kirschner, and Uri Alon. 2009. “The Incoherent Feedforward Loop Can Provide Fold-Change Detection in Gene Regulation.” Molecular Cell 36 (5): 894–99. https://doi.org/10.1016/j.molcel.2009.11.018.
Goldbeter, Albert. 2006. “Oscillations and waves of cyclic AMP in Dictyostelium: A prototype for spatio-temporal organization and pulsatile intercellular communication.” Bulletin of Mathematical Biology 68 (5): 1095–1109. https://doi.org/10.1007/s11538-006-9090-z.
Gupta, Apoorv, Irene M.Brockman Reizman, Christopher R. Reisch, and Kristala L. J. Prather. 2017. “Dynamic regulation of metabolic flux in engineered bacteria using a pathway-independent quorum-sensing circuit.” Nature Biotechnology 35 (3): 273–79. https://doi.org/10.1038/nbt.3796.
Halleran, Andrew D., Emanuel Flores-Bautista, and Richard M. Murray. 2019. “Quantitative characterization of random partitioning in the evolution of plasmid-encoded traits,” March, 594879. https://doi.org/10.1101/594879.
Holzer, Matt, Arjen Doelman, and Tasso J. Kaper. 2013. “Existence and stability of traveling pulses in a reaction-diffusion- mechanics system.” 1. Vol. 23. https://doi.org/10.1007/s00332-012-9147-0.
Kim, Jae Kyoung, Ye Chen, Andrew J. Hirning, Razan N. Alnahhas, Krešimir Josić, and Matthew R. Bennett. 2019. “Long-range temporal coordination of gene expression in synthetic microbial consortia.” Nature Chemical Biology. https://doi.org/10.1038/s41589-019-0372-9.
Larkin, Joseph W., Xiaoling Zhai, Kaito Kikuchi, Samuel E. Redford, Arthur Prindle, Jintao Liu, Sacha Greenfield, et al. 2018. “Signal Percolation within a Bacterial Community.” Cell Systems 7 (2): 137–145.e3. https://doi.org/10.1016/j.cels.2018.06.005.
Lithgow, James K., Adam Wilkinson, Andrea Hardman, Belen Rodelas, Florence Wisniewski-Dyé, Paul Williams, and J. Allan Downie. 2000. “The regulatory locus cinRI in Rhizobium leguminosarum controls a network of quorum-sensing loci.” Molecular Microbiology 37 (1): 81–97. https://doi.org/10.1046/j.1365-2958.2000.01960.x.
Noorbakhsh, Javad, David J. Schwab, Allyson E. Sgro, Thomas Gregor, and Pankaj Mehta. 2015. “Modeling oscillations and spiral waves in Dictyostelium populations.” Physical Review E - Statistical, Nonlinear, and Soft Matter Physics 91 (6): 62711. https://doi.org/10.1103/PhysRevE.91.062711.
Oleinik, O. A., A. N. Kolmogorov, and N. S. Piskunov. 2019. “Studies of the Diffusion with the Increasing Quantity of the Substance; Its Application to a Biological Problem *.” https://doi.org/10.1201/9780367810504-7.
Pearson, James P., Christian Van Delden, and Barbara H. Iglewski. 1999. “Active efflux and diffusion are involved in transport of Pseudomonas aeruginosa cell-to-cell signals.” Journal of Bacteriology 181 (4): 1203–10. https://doi.org/10.1128/jb.181.4.1203-1210.1999.
Prindle, Arthur, Jintao Liu, Munehiro Asally, San Ly, Jordi Garcia-Ojalvo, and Gürol M. Süel. 2015. “Ion channels enable electrical communication in bacterial communities.” Nature 527 (7576): 59–63. https://doi.org/10.1038/nature15709.
Prindle, Arthur, Phillip Samayoa, Ivan Razinkov, Tal Danino, Lev S. Tsimring, and Jeff Hasty. 2012. “A sensing array of radically coupled genetic ’biopixels’.” Nature 481 (7379): 39–44. https://doi.org/10.1038/nature10722.
Reátegui, Eduardo, Fatemeh Jalali, Aimal H. Khankhel, Elisabeth Wong, Hansang Cho, Jarone Lee, Charles N. Serhan, Jesmond Dalli, Hunter Elliott, and Daniel Irimia. 2017. “Microscale arrays for the profiling of start and stop signals coordinating human-neutrophil swarming.” Nature Biomedical Engineering 1 (7). https://doi.org/10.1038/s41551-017-0094.
Redfield, Rosemary J. 2002. “Is quorum sensing a side effect of diffusion sensing?” Trends in Microbiology 10 (8): 365–70. https://doi.org/10.1016/S0966-842X(02)02400-9.
Wolpert, L. 1969. “Positional information and the spatial pattern of cellular differentiation.” Journal of Theoretical Biology. https://doi.org/10.1016/S0022-5193(69)80016-0.
Yates, Edwin A., Bodo Philipp, Catherine Buckley, Steve Atkinson, Siri Ram Chhabra, R. Elizabeth Sockett, Morris Goldner, et al. 2002. “N-acylhomoserine lactones undergo lactonolysis in a pH-, temperature-, and acyl chain length-dependent manner during growth of Yersinia pseudotuberculosis and Pseudomonas aeruginosa.” Infection and Immunity 70 (10): 5635–46. https://doi.org/10.1128/IAI.70.10.5635-5646.2002.
Youk, Hyun, and Wendell A. Lim. 2014. “Secreting and sensing the same molecule allows cells to achieve versatile social behaviors.” Science 343 (6171): 1242782–2. https://doi.org/10.1126/science.1242782.
Young, Jonathan W., James C. W. Locke, Alphan Altinok, Nitzan Rosenfeld, Tigran Bacarian, Peter S. Swain, Eric Mjolsness, and Michael B. Elowitz. 2012. “Measuring single-cell gene expression dynamics in bacteria using fluorescence time-lapse microscopy.” Nature Protocols 7 (1): 80–88. https://doi.org/10.1038/nprot.2011.432.