Chapter 3 Signal propagation from isolated sender cells
3.1 Introduction
The previous chapters considered signal amplification in a context that is unlikely for a consortium of engineered bacteria to encounter outside of a man-made arena: segregated sender and amplifier populations confined to a narrow, rectangular surface. A goal of synthetic consortia research is to deploy synthetic bacterial communities to natural environments such as the mammalian gut, soils, and rhizosphere. Introducing synthetic cells to these spaces could enable long-term monitoring of the chemical and biological agents (Mimee et al. (2015), Hsiao et al. (2016), Daeffler et al. (2017)) or intervention in support of human health (Steidler, Rottiers, and Coulie (2009), Christian et al. (2014)) or crop yield (Voigt (2020), Jin et al. (2020), Avis et al. (2008)). Even when synthetic colonies can persist and maintain their individual engineered functions in the face of competition from the natural microbiome, the physical organization of consortium members cannot be determined ahead of time. The growth context of cells in these settings are porous or high-viscosity media that constrain cell motility and spatial partitioning that results in patchy colonization (Donaldson, Lee, and Mazmanian (2015), Gantner et al. (2006)). While the spatial arrangement and density of soil bacteria that interact with root systems, a context known as the rhizosphere, is the subject of active research, in situ imaging of synthetic cells associated with the rhizosphere and with roots directly depict clumped or sparse cell distributions, where cells either are in closely-packed groups of tens to hundreds or separated by distances much longer the length of a single bacterium (Gantner et al. (2006), Tecon et al. (2018), Bulgarelli et al. (2012), Nunan et al. (2006)). Bacteria inhabiting the mammalian gastrointestinal track likely form long-term communities by invading the mucus which protects intestinal and colonic epithelial cells, those that are not quickly washed out with feces, that is (Donaldson, Lee, and Mazmanian (2015), Berlec et al. (2015)). Generally, there is no guarantee that strains in sender-receiver pairs will be close enough to enable efficient communication.
The geometric characteristics of the agarose pads and sender-receiver consortia described in Chapter 2 were designed to support cell-cell signaling activity and observation of the diffusive wave dynamics. The spatial scales of bacterial communities in deployment environments are much smaller than the consortia of these propagation experiments. The aim of this chapter is to evaluate the performance of the same consortia in a patterning scenario that is more adversarial to cell-cell signaling, the case of sparse sender cells in a small colony of dense amplifiers. By growing consortia from a smaller seeding population with a relatively larger diffusive environment, the role of diffusion in diminishing local signaling concentrations is more pronounced. Analytical results suggest an approach to nondimensionalization that normalizes the spatiotemporal pattern of gene activity to the size and signal secretion rate of the sender population. This approach is used to normalize data from each experimental sample for comparison of the signaling behavior between consortia.
3.2 Amplifying communication from a single sender cell
The efficacy of cell-cell signaling via diffusive molecules depends on the geometry of the diffusive environment, the volume that permits diffusion of molecular species and its characteristics, and on the characteristics of the wave generated by the microbial consortium. In time-lapse microscopy experiments, for example, cells live in a thin aqueous layer between an agarose pad and an impermeable glass plane. The experiments described in the previous chapter involved cells spread uniformly over the surface of agarose pads fashioned to be extended in length and short in width and height. The uniformity across with pad width ensures one less dimension along which diffusion can occur, thus encouraging cell-cell communication. Under the assumption that diffusion is fast enough that signaling molecules do not form a significant gradient along the pad height, the concentration of signaling molecules in the agarose pad takes on a gradient only over the pad’s length, making the diffusive environment and the diffusive wave both one-dimensional. Greater differences between the dimensionality of the unoccupied environment and that of the diffusive signaling wave imparts a greater obstruction to cell-cell communication (Dieterle et al. (2020)). The case described here, therefore, is the most supportive of cell-cell signaling via diffusive waves.
The experiments described in this section apply a different geometry to present the consortium cells with a diffusive environment more adversarial to cell-cell signaling. Rather than deposit cells uniformly on the surface of the agarose pad, a single 25nL droplet is placed at the center of a square pad. As a result, the consortium cells form a disk of roughly 0.7mm in diameter on the surface of an agarose pad that is 4.5mm to a side and 2mm tall. The seed population contains on the order of 100 cells with a roughly 1:100 ratio of sender cells to amplifier or reporter cells. Under these conditions, there is no symmetry that ensures flat concentration profiles along any axes. Therefore, diffusion dilutes local signaling concentrations faster than in the extended-length agarose pad experiments. Figure 3.1 contains a schematic of the cell organization on the agarose pads as well as composite images of the consortia at various times.
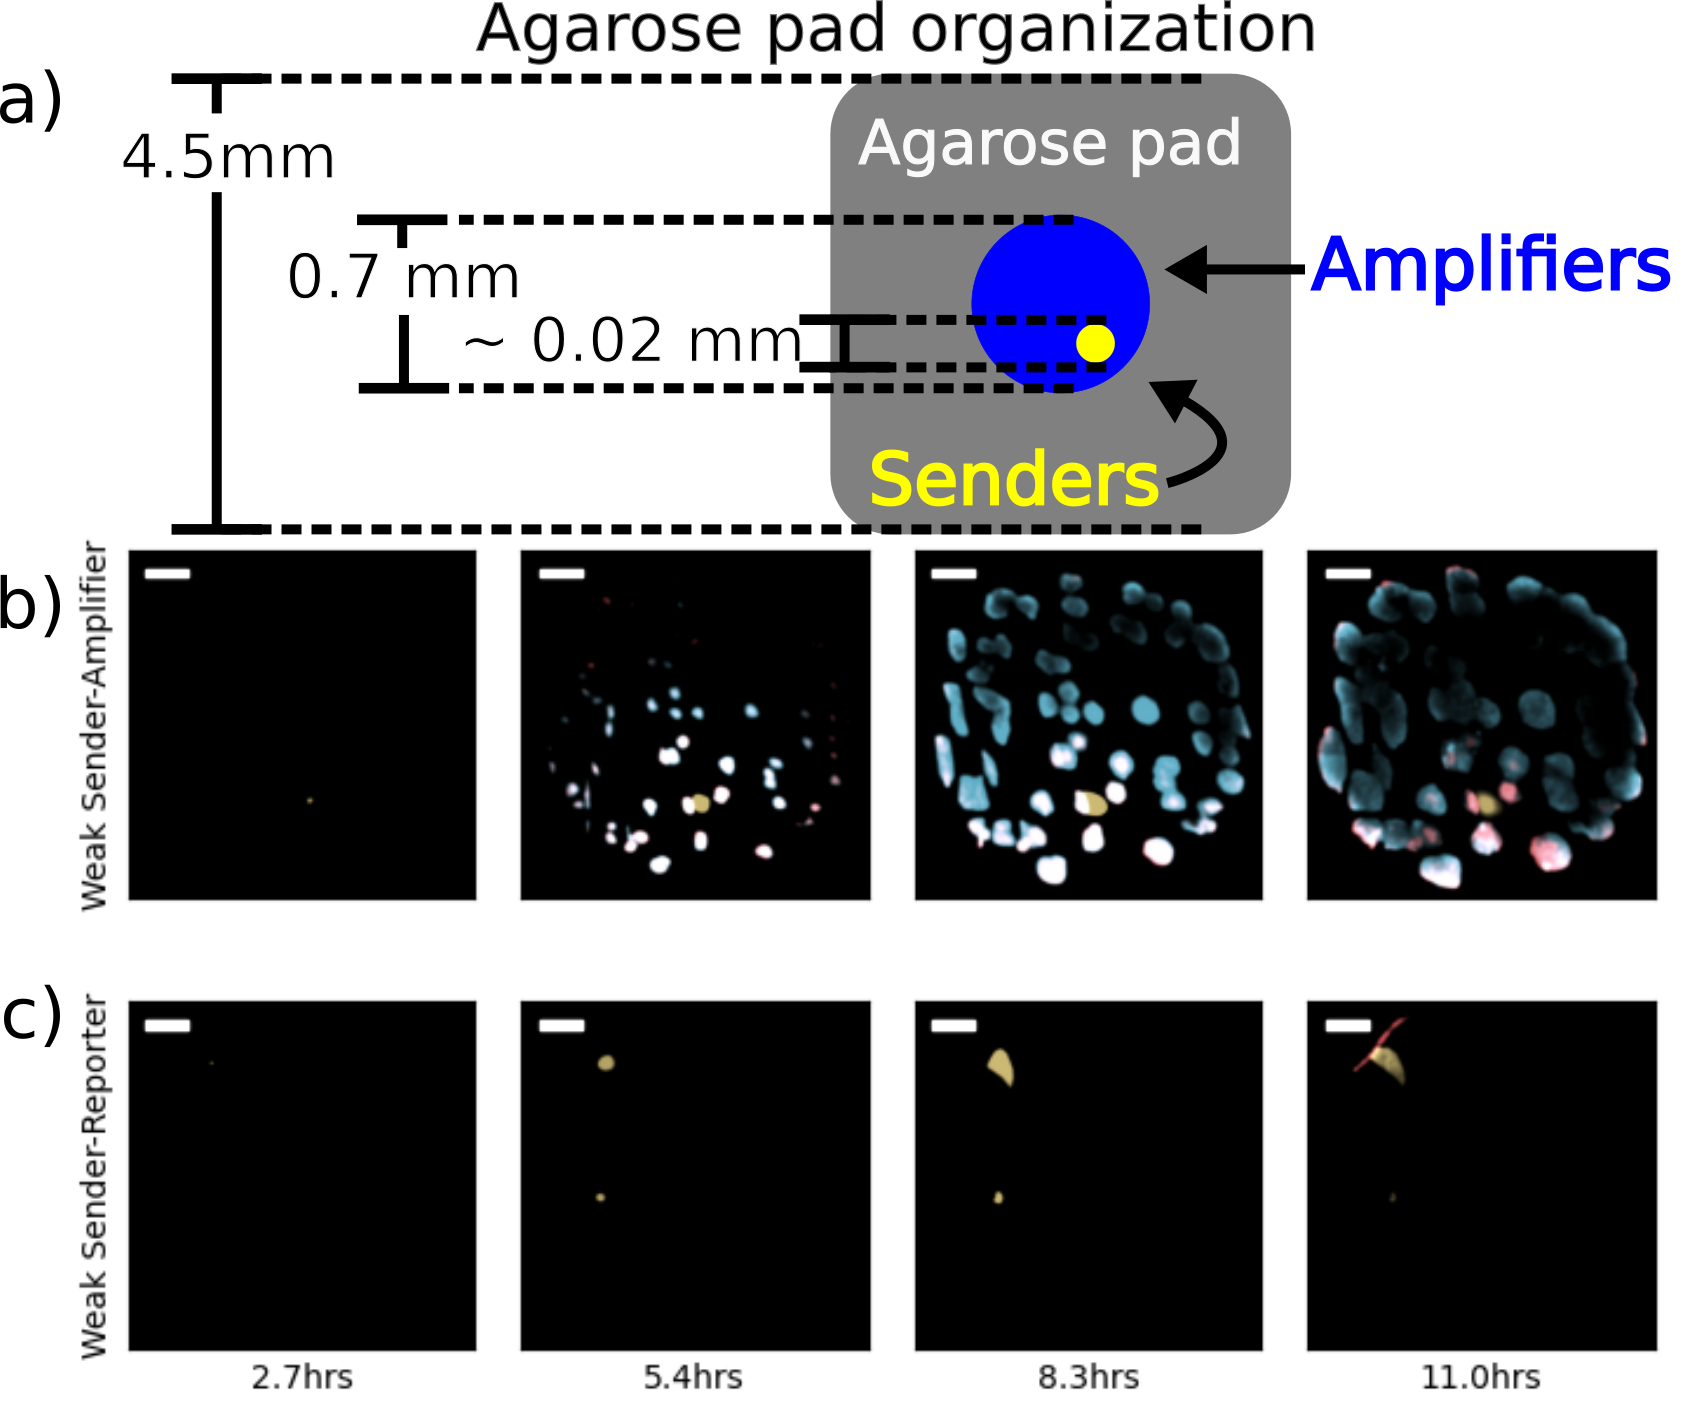
Figure 3.1: Fluorescence microscopy images of sender-amplifier consortia from two different agarose pads. The cartoon in (a) shows the size of the agarose pad and the consortium growing on it. The scenario depicted is one including a single sender population. Subfigures (b) and (c) show selected frames from experiments on sender-amplifier and sender-reporter consortia, respectively. The “Active” pad contains IPTG, thus enabling amplifier activity, while the “Inactive” pad does not. Each image is a composite of sfYFP, mScarlet-I, and SCFP3A expression. Scale bar is 100\(\mu\)m.
The sender-amplifier and sender-reporter consortia were applied to this scenario. Performance of each consortium was evaluated by two metrics: 1) how quickly a sender cell can trigger fluorescent protein production in its neighbors, and 2) the fraction of cells that have increased in fluorescence by the end of the observation period. These metrics are respectively termed response time and recruitment fraction. As before, the same pair of E. coli strains can be assayed with and without pulsatile signal amplification by the presence or absence of IPTG (see Section 2.3). While data from both the mScarlet-I and SCFP3A channels are included, only amplifier cells on pads including IPTG can produce SCFP3A. Otherwise, these cells are called “reporters” and can only express mScarlet-I. Figure 3.2 shows the response times for each condition and Figure 3.3 shows the recruitment fractions.
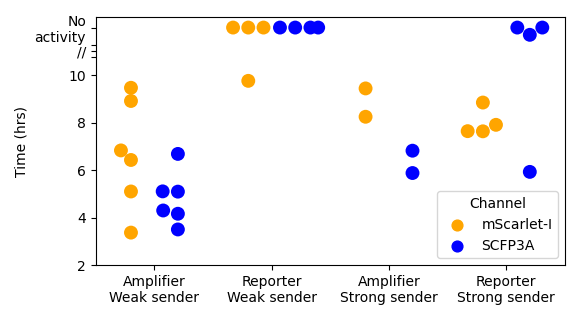
Figure 3.2: Initiation time is the duration from beginning of experiment to first threshold-crossing event from amplifier cells. These plots show initation time values calculated for each consortium and fluorescence channels. mScarlet-I fluorescence indicates repressor expression and SCFP3A indicates synthase expression. In the “Reporter/Strong sender” condition, there is a data point showing a SCFP3A threshold-crossing event at roughly 6 hours. This is the result of a putative mutant microcolony in the amplifier strain that resulted in persistent SCFP3A expression. The fact that only one such microcolony was observed out of the many sender-reporter consortia replicates suggests this is a rare event.
Comparisons between values associated with mScarlet-I fluorescence suggest that pairing amplifier cells with a “weak” sender can dramatically improve both response time and recruitment fraction relative to the case of passively signal chemical transport. The consortium containing the “strong” sender, on the other hand, show similar response times and recruitment fractions between active and passive signal propagation. However, those consortia with weak sender cells and active signal propagation exhibit the fastest responses and greater recruitment than all other experimental conditions.
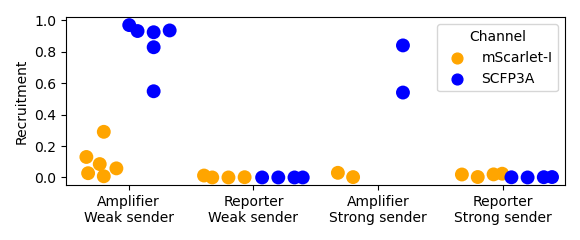
Figure 3.3: Recruitment fractions are calculated by dividing the above-threshold area by the total cell-occupied area. The area occupied by cells is determined using a low threshold on the SCFP3A fluorescence data that separates agarose autofluorescence and bacterial autofluorescence. As mentioned in the caption to Figure 3.2, one of the “Reporter/Strong sender” replicates produced a putative mutant amplifier microcolony that exhibited strong SCFP3A fluorescence. These data show that this mutant did result in a significant recruitment fraction.
Deducing the reasons for these differences in response time and recruitment fraction is confounded by the differences in the growth patterns of each consortium. These considerations include the number and arrangement of the founding population and how the microcolonies impact one another’s growth rates and protein expression capacity. As can be seen in Figure 3.1, growing microcolonies can interfere with each others’ growth by crowding. Furthermore, after 10 hours of growth it appears that only cells near microcolony edges can continue to express fluorescent protein, perhaps as a result of limited nutrient availability in the microcolony interior. To enable direct comparisons between experimental samples in a way that accounts for these details, a mathematical model was developed to formalize the expected diffusive signaling front from an isolated sender colony, considering size and growth rate.
3.3 Mathematical modeling of chemical front propagation from isolated sender cells
We will consider a disk of sender cells of radius \(r\) that is sandwiched between an impermeable boundary and a porous medium of infinite height and radius. At time \(t=0\), the sender cells are induced to express synthase protein. The cells are assumed to reach equilibrium cellular concentrations of synthase immediately, allowing for the total amount of synthase to be proportional to the cell number. Therefore, synthase increases exponentially with rate constant \(\lambda\). The production rate per unit area is therefore \[\begin{equation} f(x,t) = c_0\Theta(r-x)\Theta(t)e^{\lambda t}, \tag{3.1} \end{equation}\] where \(c_0\) is the AHL emission rate at the moment of induction and \(\Theta\) is the Heaviside function. These features closely resemble the experimental scenarios, to a point. Once amplifier cells secrete AHL or nutrient limitations attenuate cell growth and protein expression, the model assumptions no longer describe consortia behavior. However, we will see that the diffusive waves propagated in sender-amplifier consortia appear to match those predicted by the math model. This will enable us in Section 3.4 to compare consortia on the basis of their apparent sender strengths as represented by the emission rate parameter \(c_0\).
We will use the method of fundamental solutions to solve for \(a(x,t)\), the concentration of AHL at a point \(x\) at time \(t\). We begin with the differential equation governing signal diffusion in the agarose pad, including a source term representing secretion from the sender population, the inhomogeneous heat equation \[\partial_ta(x,t) = \nabla^2 a(x,t) + f(x,t),\] where the rate of change in concentration is a combination of diffusion and production terms. The solution to the inhomogeneous heat equation can be found by convolution of the fundamental solution with the inhomogeneous term. Here the heat kernel \(g\) must respect the no-flux boundary condition. The placement of sender cells on the boundary provides a convenient symmetry: the heat kernel for an unbounded 3D domain is multiplied by a factor of 2, effectively superimposing the portion of the distribution that would extend past the boundary back onto available volume. This yields the function \[ G(x,t) = \frac{1}{4(\pi D (t-\tau))^{3/2}}e^{\frac{-p(x)^2}{4D(t-\tau)}}, \] where \(p(x)\) represents the distance from the point \(x\) and the center of the kernel function. The convolution integral will use polar coordinates with the origin located at the center of the disk of sender cells and vary over time and the area of the disk to determine the concentration at the space-time coordinate \((x,t)\). Radial symmetry allows the position \(x\) to be restricted to \(\{(R,\theta)|\theta=0,R>r,R\in \mathbb{R}^+ \}\) without loss of generality. To calculate the distance \(p\) at position \(x\), we use
\[ p(R,\theta,x) = \sqrt{(R\,\mathrm{Cos}(\theta)-x)^2+(R\,\mathrm{Sin}(\theta))} \:.\] Composing the convolution integral yields
\[ a(x,t) = \int_0^{2\pi} \mathrm{d}\theta \int_0^\infty\mathrm{d}R \int_0^t\mathrm{d}\tau\;f(x,\tau) \frac{Re^{\frac{-p(R,\theta,x)^2}{4D(t-\tau)}}}{4(\pi D (t-\tau))^{3/2}} \:\:,\] which becomes
\[ a(x,t) = \int_0^{\pi} \mathrm{d}\theta \int_0^r\mathrm{d}R \int_0^t\mathrm{d}\tau\;c_0e^{\lambda t} \frac{Re^{\frac{-p(R,\theta,x)^2}{4D(t-\tau)}}}{2(\pi D (t-\tau))^{3/2}} \] after substituting \(f(x,\tau)\), restricting the integrals to non-zero values of the Heaviside function, and applying symmetry across the x-axis to reduce the integral over \(\theta\) to the range \([0,\pi]\). Next, a change of variables \(\psi_x(R,\theta)\) is applied to re-center the polar coordinates from the center of the sender population to the point \(x\):
\[\mathbf u=(R,\theta), \] \[\psi_x(\mathbf u)=(p(R,\theta,x),\mathrm{ArcTan}(\frac{R\:\mathrm{Sin}(\theta)}{R\:\mathrm{Cos}(\theta)+x}), \]
\[|\mathrm{det}(D\psi)(\mathbf u)| = \frac{p(R,\theta,x)}{R}.\]
The result of this operation is a more tractable integrand and \(\theta\) integration bounds that depend on \(R\):
\[\int_{x-r}^{x+r}\mathrm{d}R \int_{\mathrm{ArcCos}(\frac{r^2-x^2-R^2}{2xR})}^{\pi} \mathrm{d}\theta \int_0^t\mathrm{d}\tau\;c_0e^{\lambda t}\frac{Re^{\frac{-R^2}{4D(t-\tau)}}}{2(\pi D (t-\tau))^{3/2}} .\]
From here, the integrals are resolved individually, beginning with \(\tau\). The \(\tau\) integral can be performed by applying a change of variables \(\tilde{\tau}=t-\tau\) and results in a sum of complementary error functions
\[\begin{equation} \begin{split} \int_{x-r}^{x+r}\mathrm{d}R \int_{\mathrm{ArcCos}(\frac{r^2-x^2-R^2}{2xR})}^{\pi} \mathrm{d}\theta \frac{c_0}{2D\pi} e^{\lambda t-R\sqrt{\frac{\lambda}{D}}} ( & \mathrm{Erfc}(\frac{R}{2\sqrt{Dt}} - \sqrt{\frac{\lambda}{D}} t) + \\ e^{2R\sqrt{\frac{\lambda}{D}}}&\mathrm{Erfc}(\frac{R}{2\sqrt{Dt}} + \sqrt{\frac{\lambda}{D}} t)) \end{split}. \tag{3.2} \end{equation}\]
At this stage, we apply estimates for the parameters \(r\), \(D\), \(\lambda\), and the variable \(t\). Figures 3.1 and 3.2, and knowledge of the AHL signaling molecules, suggest the following:
- The earliest response occurs after roughly 3 hours.
- Sending colonies are roughly 20\(\mu\)m in diameter.
- \(x\) is bounded from above by 1mm.
- \(D\approx200\frac{\mu\mathrm{m}}{\mathrm{s}^2}\) (Dilanji et al. (2012)).
- Synthase accumulation should roughly match cell growth, or \(\lambda\approx10^{-3}/\mathrm s\).
These approximations motivate the following simplifying assumptions:
- \(\frac{R}{2\sqrt{Dt}} \approx 0\)
- \(\sqrt\frac{\lambda}{D}t \gg 0\)
- \(\lambda t - R \sqrt \frac{\lambda}{D} \approx \lambda t\)
With these assumptions, the sum of the \(\mathrm{Erfc}\) terms within the parenthesis of Equation (3.2) evaluates to 2 and all dependence on \(R\) within the integrand disappears, leaving
\[ \begin{split} a(x,t) &= \int_{x-r}^{x+r}\mathrm{d}R \int_{\mathrm{ArcCos}(\frac{r^2-x^2-R^2}{2xR})}^{\pi} \mathrm{d}\theta \; \frac{c_0}{D\pi} e^{\lambda t} \\ &= \frac{c_0}{D\pi} e^{\lambda t} \int_{x-r}^{x+r}\mathrm{d}R \;\;\pi - \mathrm{ArcCos}(\frac{r^2-x^2-R^2}{2xR}) . \end{split} \]
Here we apply a lower-bound approximation \[\pi-\mathrm{ArcCos(\frac{r^2-x^2-R^2}{2xR})}\geq \mathrm{ArcCsc}(x/r)\frac{2}{\pi}\] and ultimately recover
\[\begin{equation} a(x,t) = \frac{4 c_0}{D\pi^2} r \mathrm{ArcCsc(x/r)} e^{\lambda t} . \tag{3.3} \end{equation}\]
As the sender colony radius is a fixed parameter in this case, we conclude from Equation (3.3) that front propagation occurs rapidly and concentration grows exponentially at all positions.
3.4 Analyzing nondimensionalized wave propagation
Equation (3.3) suggests a nondimensionalization of time and position according to the arguments for the trigonometric and exponential functions, \(x/r\) and \(\lambda t\). This enables comparisons between consortia in a way that reduces the impact of variability in sender microcolony position, size, and growth. The term \(c_0\) can further be nondimensionalized by normalizing to the minimum activation concentration for each channel’s promoter, forming the nondimensional term \(\frac{4c_0r}{c_{th}D{\pi}^2}\).
When applying the nondimensionalization, it is essential to also consider the assumption of exponential accumulation of synthase molecule. The sender cells’ bicistronic expression of CinI and YFP allows for the identification of the period of exponential accumulation of CinI. Restricting curve fitting to only data from this period duplicates the results of Figure 3.2: reporter components in the “weak sender”-reporter consortia show almost zero response to signaling activity. The only sample out of four which shows any reporter activity is depicted in Figure 3.1.c), and fluorescence in this case began after the period of exponential CinI accumulation. This suggests that senders are emitting AHL at a very slow rate, possibly less than 3000 molecules per second per square micron, at peak CinI accumulation.
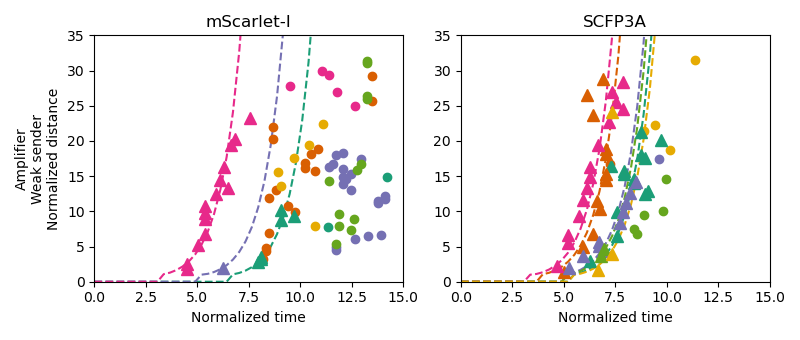
Figure 3.4: These plots depict threshold-crossing events using nondimensionalized position and time values along with best-fit lines to the propagation model. Triangular points correspond to threshold-crossing events that occurred while the sender microcolonies were rapidly growing and circular points represent data from after cell growth slowed. Only triangular data points were used in model fitting. Data from the same pad are colored similarly between the channel plots.
Consortia with active signal propagation, on the other hand, have best-fit lines for their SFP3A threshold-crossing events that largely fall atop one another, showing agreement in behavior despite the variability in the founding population. It is also notable that these best-fit lines appear to represent the data well, despite violating the model assumption restricting AHL emission to the sender colony. These estimates of \(c_0\), therefore, can provide a metric for how quickly a consortium propagates signal fronts away from sender cells, with larger values implying a faster response. Figure 3.5 shows estimates from each threshold-crossing event as well as those correspond to the fitted lines for each experimental pad. These results highlight the benefit provided by signal amplification in scenarios where the diffusive environment is adversarial to cell-cell communication within a consortium.
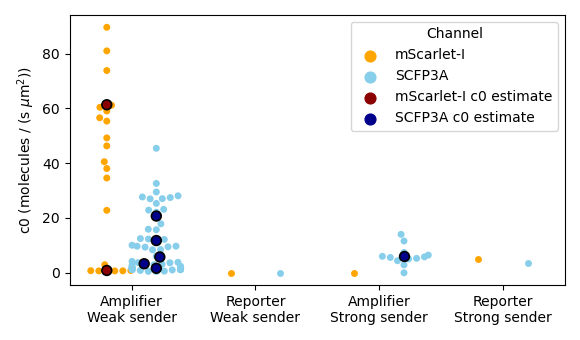
Figure 3.5: These data are estimates of initial signal emission rate density, \(c_0\). The color dots correspond to estimates from an individual threshold-crossing event and white/black dots correspond to model fits from a single agarose pad as depicted in Figure 3.4. Channel-specific threshold concentrations were \(10/\mu\text{m}^3\) and \(20/\mu\text{m}^3\) for the promoters of SCFP3A and mScarlet-I, respectively, for model-fitting. Fits were not performed when there were fewer than three threshold-crossing events available.
3.5 Methods
Cells were deposited in droplets onto agarose pads and allowed to dry. The droplets were either 1uL in volume and placed by pipette onto agarose pads 10mm by 10mm or 25nL in volume and transferred via acoustic liquid handler onto pads 5mm by 5mm. Once dried, the seeding colonies were roughly 2mm in diameter in the former case and 700um in the latter. The agarose pads were observed via fluorescence microscopy and incubated at 37 degrees Celsius.
Agarose pads contained chemical inducers that enabled different consortia behavior. In one set, pads contained both Rpa-AHL and IPTG to enable sender and amplifier activity. In the other set, pads contained only Rpa-AHL. The Rpa-AHL-only pads would allow amplifier cells to express mScarlet-I in response to signaling activity, but not contribute to it.
References
Avis, Tyler J., Valérie Gravel, Hani Antoun, and Russell J. Tweddell. 2008. “Multifaceted beneficial effects of rhizosphere microorganisms on plant health and productivity.” Soil Biology and Biochemistry 40 (7): 1733–40. https://doi.org/10.1016/j.soilbio.2008.02.013.
Berlec, Aleš, Janja Završnik, Miha Butinar, Boris Turk, and Borut Štrukelj. 2015. “In vivo imaging of Lactococcus lactis, Lactobacillus plantarum and Escherichia coli expressing infrared fluorescent protein in mice.” Microbial Cell Factories. https://doi.org/10.1186/s12934-015-0376-4.
Bulgarelli, Davide, Matthias Rott, Klaus Schlaeppi, Emiel Ver Loren van Themaat, Nahal Ahmadinejad, Federica Assenza, Philipp Rauf, et al. 2012. “Revealing structure and assembly cues for Arabidopsis root-inhabiting bacterial microbiota.” Nature 488 (7409): 91–95. https://doi.org/10.1038/nature11336.
Christian, David A., Anita A. Koshy, Morgan A. Reuter, Michael R. Betts, John C. Boothroyd, and Christopher A. Hunter. 2014. “Use of transgenic parasites and host reporters to dissect events that promote interleukin-12 production during toxoplasmosis.” Infection and Immunity 82 (10): 4056–67. https://doi.org/10.1128/IAI.01643-14.
Daeffler, Kristina N‐M, Jeffrey D Galley, Ravi U Sheth, Laura C Ortiz‐Velez, Christopher O Bibb, Noah F Shroyer, Robert A Britton, and Jeffrey J Tabor. 2017. “Engineering bacterial thiosulfate and tetrathionate sensors for detecting gut inflammation.” Molecular Systems Biology 13 (4): 923. https://doi.org/10.15252/msb.20167416.
Dieterle, Paul B, Jiseon Min, Daniel Irimia, and Ariel Amir. 2020. “Dynamics of diffusive cell signaling relays.” eLife 9. https://doi.org/10.7554/elife.61771.
Dilanji, Gabriel E., Jessica B. Langebrake, Patrick De Leenheer, and Stephen J. Hagen. 2012. “Quorum activation at a distance: Spatiotemporal patterns of gene regulation from diffusion of an autoinducer signal.” Journal of the American Chemical Society 134 (12): 5618–26. https://doi.org/10.1021/ja211593q.
Donaldson, Gregory P., S. Melanie Lee, and Sarkis K. Mazmanian. 2015. “Gut biogeography of the bacterial microbiota.” Nature Reviews Microbiology 14 (1): 20–32. https://doi.org/10.1038/nrmicro3552.
Gantner, Stephan, Michael Schmid, Christine Dürr, Regina Schuhegger, Anette Steidle, Peter Hutzler, Christian Langebartels, Leo Eberl, Anton Hartmann, and Frank B. Dazzo. 2006. “In situ quantitation of the spatial scale of calling distances and population density-independent N-acylhomoserine lactone-mediated communication by rhizobacteria colonized on plant roots.” FEMS Microbiology Ecology 56 (2): 188–94. https://doi.org/10.1111/j.1574-6941.2005.00037.x.
Hsiao, Victoria, Yutaka Hori, Paul WK Rothemund, and Richard M Murray. 2016. “A population‐based temporal logic gate for timing and recording chemical events.” Molecular Systems Biology 12 (5): 869. https://doi.org/10.15252/msb.20156663.
Jin, Zi Jing, Lian Zhou, Shuang Sun, Ying Cui, Kai Song, Xuehong Zhang, and Ya Wen He. 2020. “Identification of a Strong Quorum Sensing- And Thermo-Regulated Promoter for the Biosynthesis of a New Metabolite Pesticide Phenazine-1-carboxamide in Pseudomonas strain PA1201.” ACS Synthetic Biology 9 (7): 1802–12. https://doi.org/10.1021/acssynbio.0c00161.
Mimee, Mark, Alex C. Tucker, Christopher A. Voigt, and Timothy K. Lu. 2015. “Programming a Human Commensal Bacterium, Bacteroides thetaiotaomicron, to Sense and Respond to Stimuli in the Murine Gut Microbiota.” Cell Systems 1 (1): 62–71. https://doi.org/10.1016/j.cels.2015.06.001.
Nunan, Naoise, Karl Ritz, David Crabb, Kirsty Harris, Keijan Wu, John W. Crawford, and Iain M. Young. 2006. “Quantification of the in situ distribution of soil bacteria by large-scale imaging of thin sections of undisturbed soil.” FEMS Microbiology Ecology 37 (1): 67–77. https://doi.org/10.1111/j.1574-6941.2001.tb00854.x.
Steidler, Lothar, Pieter Rottiers, and Bernard Coulie. 2009. “Actobiotics™ as a novel method for cytokine delivery: The interleukin-10 case.” In Annals of the New York Academy of Sciences, 1182:135–45. https://doi.org/10.1111/j.1749-6632.2009.05067.x.
Tecon, Robin, Ali Ebrahimi, Hannah Kleyer, Shai Erev Levi, and Dani Or. 2018. “Cell-to-cell bacterial interactions promoted by drier conditions on soil surfaces.” Proceedings of the National Academy of Sciences of the United States of America 115 (39): 9791–6. https://doi.org/10.1073/pnas.1808274115.
Voigt, Christopher A. 2020. “Synthetic biology 2020–2030: six commercially-available products that are changing our world.” Nature Communications 11 (1): 6379. https://doi.org/10.1038/s41467-020-20122-2.